Verified against official sourcesLast updated

ExamBharo

Type to search · Esc to close

ExamBharo · SSC CGL 2024 Tier II — Statistics — 19 January 2025 · exambharo.com/previous-year-papers/ssc-cgl-2024-tier-2-statistics-19-jan/

Question paper · SSC CGL

SSC CGL 2024 Tier II — Statistics — 19 January 2025

19 January 2025 · 9:00 AM–11:00 AM81 of the paper’s 100 questions1 per correct answer

19 questions of the original paper are not included: those that need a figure or formatting we cannot show, that have no answer in the response sheet, or that we could not check against a second copy of the paper.

Questions from the Staff Selection Commission’s paper of 19 January 2025, 9:00 AM–11:00 AM. Each question’s answer is under it, hidden until you open it, and the full answer key is at the end. Take the paper as a timed practice test to be scored.

Statistics

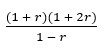
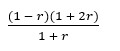
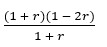
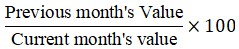
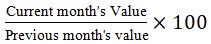
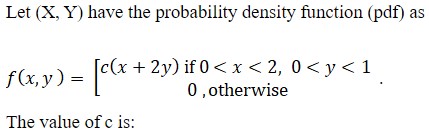
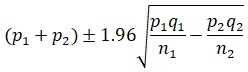
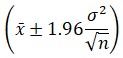
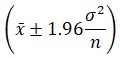
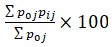
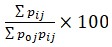
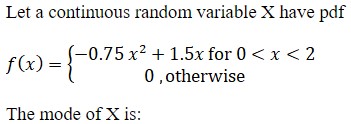
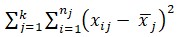
  1. 1. Figure for question 1

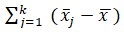
    • (a) Figure for question 1, option (a)
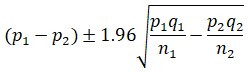
    • (b) Figure for question 1, option (b)
    • (c) Figure for question 1, option (c)
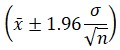
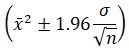
    • (d) Figure for question 1, option (d)
    Show answer

    Answer: (d)

  2. 2. Monthly sales data (in units) shows the following trend-adjusted ratios for three months: January (1.1), February (0.9), and March (1.0). What is the average seasonal index for this quarter?

    • (a) 0.95
    • (b) 0.9
    • (c) 1.0
    • (d) 1.1
    Show answer

    Answer: (c)

  3. 3. Duncan’s Multiple Range Test makes use of which statistical measure?

    • (a) Standard Error of the Means
    • (b) Regression Coefficient
    • (c) Range Statistic (R)
    • (d) F-statistic
    Show answer

    Answer: (c)

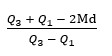
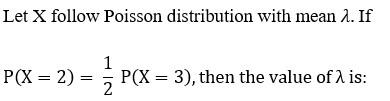
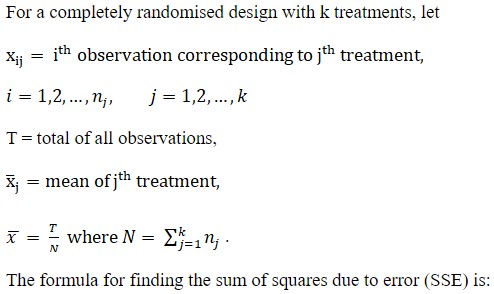
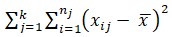
  4. 4. Figure for question 4

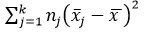
    • (a) Figure for question 4, option (a)
    • (b) Figure for question 4, option (b)
    • (c) Figure for question 4, option (c)
    • (d) Figure for question 4, option (d)
    Show answer

    Answer: (c)

  5. 6. If the critical region is evenly distributed, then the test is referred to as:

    • (a) Three tailed
    • (b) Zero tailed
    • (c) One tailed
    • (d) Two tailed
    Show answer

    Answer: (d)

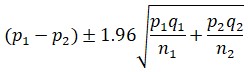
  6. 7. Figure for question 7

    • (a) Figure for question 7, option (a)
    • (b) Figure for question 7, option (b)
    • (c) Figure for question 7, option (c)
    • (d) Figure for question 7, option (d)
    Show answer

    Answer: (c)

  7. 8. In a two-way ANOVA, how many hypotheses are tested?

    • (a) Three
    • (b) One
    • (c) Four
    • (d) Two
    Show answer

    Answer: (a)

  8. 9. In ANCOVA, what happens when the covariate is not linearly related to the dependent variable?

    • (a) The results of ANCOVA may be biased.
    • (b) The covariate becomes irrelevant.
    • (c) All assumptions of ANCOVA are met.
    • (d) The F-statistic becomes insignificant.
    Show answer

    Answer: (a)

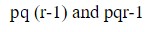
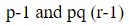
  9. 10. Let X and Y be two independent Poisson variates with rate 5 and 10, respectively, then the E(XY=2) is equal to:

    • (a) Figure for question 10, option (a)
    • (b) Figure for question 10, option (b)
    • (c) Figure for question 10, option (c)
    • (d) Figure for question 10, option (d)
    Show answer

    Answer: (b)

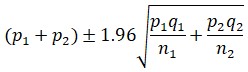
  10. 11. Figure for question 11

    • (a) Figure for question 11, option (a)
    • (b) Figure for question 11, option (b)
    • (c) Figure for question 11, option (c)
    • (d) Figure for question 11, option (d)
    Show answer

    Answer: (b)

  11. 12. Figure for question 12

    • (a) Figure for question 12, option (a)
    • (b) Figure for question 12, option (b)
    • (c) Figure for question 12, option (c)
    • (d) Figure for question 12, option (d)
    Show answer

    Answer: (c)

  12. 13. Figure for question 13

    • (a) Figure for question 13, option (a)
    • (b) Figure for question 13, option (b)
    • (c) Figure for question 13, option (c)
    • (d) Figure for question 13, option (d)
    Show answer

    Answer: (d)

  13. 14. Figure for question 14

    • (a) Figure for question 14, option (a)
    • (b) Figure for question 14, option (b)
    • (c) Figure for question 14, option (c)
    • (d) Figure for question 14, option (d)
    Show answer

    Answer: (a)

  14. 15. Figure for question 15

    • (a) Figure for question 15, option (a)
    • (b) Figure for question 15, option (b)
    • (c) Figure for question 15, option (c)
    • (d) Figure for question 15, option (d)
    Show answer

    Answer: (b)

  15. 17. Figure for question 17

    • (a) Figure for question 17, option (a)
    • (b) Figure for question 17, option (b)
    • (c) Figure for question 17, option (c)
    • (d) Figure for question 17, option (d)
    Show answer

    Answer: (c)

  16. 18. Figure for question 18

    • (a) Figure for question 18, option (a)
    • (b) Figure for question 18, option (b)
    • (c) Figure for question 18, option (c)
    • (d) Figure for question 18, option (d)
    Show answer

    Answer: (a)

  17. 20. Figure for question 20

    • (a) Figure for question 20, option (a)
    • (b) Figure for question 20, option (b)
    • (c) Figure for question 20, option (c)
    • (d) Figure for question 20, option (d)
    Show answer

    Answer: (b)

  18. 22. Figure for question 22

    • (a) Figure for question 22, option (a)
    • (b) Figure for question 22, option (b)
    • (c) Figure for question 22, option (c)
    • (d) Figure for question 22, option (d)
    Show answer

    Answer: (c)

  19. 23. For testing whether two independent Normal populations (with unknown and equal variances) have same mean, one uses:

    • (a) t distribution
    • (b) Standard Normal Distribution
    • (c) Chi Square Distribution
    • (d) F distribution
    Show answer

    Answer: (a)

  20. 24. The following data represents a time series. Period : 1 2 3 4 5 Observed values : 150 140 160 170 180 Compute the first-order and second-order differences for period 3.

    • (a) First-Order: 20, Second-Order: −30
    • (b) First-Order: −10, Second-Order: −10
    • (c) First-Order: −10, Second-Order: 20
    • (d) First-Order: 20, Second-Order: 10
    Show answer

    Answer: (a)

  21. 26. Figure for question 26

    • (a) Figure for question 26, option (a)
    • (b) Figure for question 26, option (b)
    • (c) Figure for question 26, option (c)
    • (d) Figure for question 26, option (d)
    Show answer

    Answer: (c)

  22. 27. A model being fitted is said to be adequate if the residual plot:

    • (a) is quadratic
    • (b) is non-linear
    • (c) is U-shaped
    • (d) displays random pattern
    Show answer

    Answer: (d)

  23. 28. Figure for question 28

    • (a) Figure for question 28, option (a)
    • (b) Figure for question 28, option (b)
    • (c) Figure for question 28, option (c)
    • (d) Figure for question 28, option (d)
    Show answer

    Answer: (b)

  24. 29. Figure for question 29

    • (a) Figure for question 29, option (a)
    • (b) Figure for question 29, option (b)
    • (c) Figure for question 29, option (c)
    • (d) Figure for question 29, option (d)
    Show answer

    Answer: (c)

  25. 30. Figure for question 30

    • (a) Figure for question 30, option (a)
    • (b) Figure for question 30, option (b)
    • (c) Figure for question 30, option (c)
    • (d) Figure for question 30, option (d)
    Show answer

    Answer: (a)

  26. 32. Figure for question 32

    • (a) Figure for question 32, option (a)
    • (b) Figure for question 32, option (b)
    • (c) Figure for question 32, option (c)
    • (d) Figure for question 32, option (d)
    Show answer

    Answer: (c)

  27. 33. Figure for question 33

    • (a) Figure for question 33, option (a)
    • (b) Figure for question 33, option (b)
    • (c) Figure for question 33, option (c)
    • (d) Figure for question 33, option (d)
    Show answer

    Answer: (c)

  28. 34. Level of significance is:

    • (a) Probability of Type I Error
    • (b) 1 − Probability of Type I Error
    • (c) 1 − Probability of Type II Error
    • (d) Probability of Type II Error
    Show answer

    Answer: (a)

  29. 35. Figure for question 35

    • (a) Figure for question 35, option (a)
    • (b) Figure for question 35, option (b)
    • (c) Figure for question 35, option (c)
    • (d) Figure for question 35, option (d)
    Show answer

    Answer: (b)

  30. 36. Figure for question 36

    • (a) Figure for question 36, option (a)
    • (b) Figure for question 36, option (b)
    • (c) Figure for question 36, option (c)
    • (d) Figure for question 36, option (d)
    Show answer

    Answer: (d)

  31. 37. Figure for question 37

    • (a) Figure for question 37, option (a)
    • (b) Figure for question 37, option (b)
    • (c) Figure for question 37, option (c)
    • (d) Figure for question 37, option (d)
    Show answer

    Answer: (b)

  32. 38. Before using secondary data, one need NOT verify:

    • (a) reliability of data
    • (b) suitability of data
    • (c) expenditure involved at time of collection of data
    • (d) adequacy of data
    Show answer

    Answer: (c)

  33. 39. Figure for question 39

    • (a) Figure for question 39, option (a)
    • (b) Figure for question 39, option (b)
    • (c) Figure for question 39, option (c)
    • (d) Figure for question 39, option (d)
    Show answer

    Answer: (b)

  34. 41. Figure for question 41

    • (a) Figure for question 41, option (a)
    • (b) Figure for question 41, option (b)
    • (c) Figure for question 41, option (c)
    • (d) Figure for question 41, option (d)
    Show answer

    Answer: (a)

  35. 42. Figure for question 42

    • (a) Figure for question 42, option (a)
    • (b) Figure for question 42, option (b)
    • (c) Figure for question 42, option (c)
    • (d) Figure for question 42, option (d)
    Show answer

    Answer: (c)

  36. 43. Figure for question 43

    • (a) Figure for question 43, option (a)
    • (b) Figure for question 43, option (b)
    • (c) Figure for question 43, option (c)
    • (d) Figure for question 43, option (d)
    Show answer

    Answer: (d)

  37. 44. Figure for question 44

    • (a) Figure for question 44, option (a)
    • (b) Figure for question 44, option (b)
    • (c) Figure for question 44, option (c)
    • (d) Figure for question 44, option (d)
    Show answer

    Answer: (c)

  38. 45. Figure for question 45

    • (a) Figure for question 45, option (a)
    • (b) Figure for question 45, option (b)
    • (c) Figure for question 45, option (c)
    • (d) Figure for question 45, option (d)
    Show answer

    Answer: (c)

  39. 46. Figure for question 46

    • (a) Figure for question 46, option (a)
    • (b) Figure for question 46, option (b)
    • (c) Figure for question 46, option (c)
    • (d) Figure for question 46, option (d)
    Show answer

    Answer: (a)

  40. 47. O-gives are NOT useful for locating:

    • (a) percentiles
    • (b) median
    • (c) quartiles
    • (d) mean
    Show answer

    Answer: (d)

  41. 48. Figure for question 48

    • (a) Figure for question 48, option (a)
    • (b) Figure for question 48, option (b)
    • (c) Figure for question 48, option (c)
    • (d) Figure for question 48, option (d)
    Show answer

    Answer: (c)

  42. 49. Which component of a time series represents short-term fluctuations due to seasonal factors?

    • (a) Seasonal component
    • (b) Irregular component
    • (c) Cyclical component
    • (d) Trend
    Show answer

    Answer: (a)

  43. 50. Figure for question 50

    • (a) Figure for question 50, option (a)
    • (b) Figure for question 50, option (b)
    • (c) Figure for question 50, option (c)
    • (d) Figure for question 50, option (d)
    Show answer

    Answer: (b)

  44. 51. Which of the following statements is FALSE?

    • (a) An alternative hypothesis is complementary to null hypothesis.
    • (b) The hypothesis for testing mu < mu0 is two sided / two tailed.
    • (c) The null hypothesis H0: mu = mu0 can be tested against the alternative H1: mu not equal to mu0.
    • (d) The hypothesis for testing mu > mu0 is one sided / right tailed.
    Show answer

    Answer: (b)

  45. 52. Figure for question 52

    • (a) Figure for question 52, option (a)
    • (b) Figure for question 52, option (b)
    • (c) Figure for question 52, option (c)
    • (d) Figure for question 52, option (d)
    Show answer

    Answer: (d)

  46. 53. Figure for question 53

    • (a) Figure for question 53, option (a)
    • (b) Figure for question 53, option (b)
    • (c) Figure for question 53, option (c)
    • (d) Figure for question 53, option (d)
    Show answer

    Answer: (a)

  47. 54. Figure for question 54

    • (a) Figure for question 54, option (a)
    • (b) Figure for question 54, option (b)
    • (c) Figure for question 54, option (c)
    • (d) Figure for question 54, option (d)
    Show answer

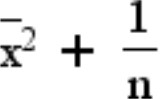
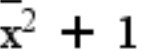
    Answer: (c)

  48. 55. If S2 is the sample variance of a sample of size n and s2 is an unbiased estimator of population variance, then which of the following is true?

    • (a) Figure for question 55, option (a)
    • (b) Figure for question 55, option (b)
    • (c) Figure for question 55, option (c)
    • (d) Figure for question 55, option (d)
    Show answer

    Answer: (b)

  49. 56. Figure for question 56

    • (a) Figure for question 56, option (a)
    • (b) Figure for question 56, option (b)
    • (c) Figure for question 56, option (c)
    • (d) Figure for question 56, option (d)
    Show answer

    Answer: (a)

  50. 58. Figure for question 58

    • (a) Figure for question 58, option (a)
    • (b) Figure for question 58, option (b)
    • (c) Figure for question 58, option (c)
    • (d) Figure for question 58, option (d)
    Show answer

    Answer: (a)

  51. 59. Figure for question 59

    • (a) Figure for question 59, option (a)
    • (b) Figure for question 59, option (b)
    • (c) Figure for question 59, option (c)
    • (d) Figure for question 59, option (d)
    Show answer

    Answer: (b)

  52. 60. It has been found that 2% of the tools produced by a certain machine are defective. What is the probability that in a shipment of 400 such tools, 3% or more will be defective? (Probability that the normal variate lies between 0 and 1.43 is 0.4236.)

    • (a) 0.0764
    • (b) 0.50
    • (c) 0.4236
    • (d) 1.43
    Show answer

    Answer: (a)

  53. 62. Figure for question 62

    • (a) Figure for question 62, option (a)
    • (b) Figure for question 62, option (b)
    • (c) Figure for question 62, option (c)
    • (d) Figure for question 62, option (d)
    Show answer

    Answer: (a)

  54. 63. Figure for question 63

    • (a) Figure for question 63, option (a)
    • (b) Figure for question 63, option (b)
    • (c) Figure for question 63, option (c)
    • (d) Figure for question 63, option (d)
    Show answer

    Answer: (b)

  55. 64. Figure for question 64

    • (a) Figure for question 64, option (a)
    • (b) Figure for question 64, option (b)
    • (c) Figure for question 64, option (c)
    • (d) Figure for question 64, option (d)
    Show answer

    Answer: (b)

  56. 65. Figure for question 65

    • (a) Figure for question 65, option (a)
    • (b) Figure for question 65, option (b)
    • (c) Figure for question 65, option (c)
    • (d) Figure for question 65, option (d)
    Show answer

    Answer: (a)

  57. 66. Figure for question 66

    • (a) Figure for question 66, option (a)
    • (b) Figure for question 66, option (b)
    • (c) Figure for question 66, option (c)
    • (d) Figure for question 66, option (d)
    Show answer

    Answer: (d)

  58. 67. Figure for question 67

    • (a) Figure for question 67, option (a)
    • (b) Figure for question 67, option (b)
    • (c) Figure for question 67, option (c)
    • (d) Figure for question 67, option (d)
    Show answer

    Answer: (c)

  59. 68. Figure for question 68

    • (a) Figure for question 68, option (a)
    • (b) Figure for question 68, option (b)
    • (c) Figure for question 68, option (c)
    • (d) Figure for question 68, option (d)
    Show answer

    Answer: (d)

  60. 69. Figure for question 69

    • (a) Figure for question 69, option (a)
    • (b) Figure for question 69, option (b)
    • (c) Figure for question 69, option (c)
    • (d) Figure for question 69, option (d)
    Show answer

    Answer: (b)

  61. 70. Figure for question 70

    • (a) Figure for question 70, option (a)
    • (b) Figure for question 70, option (b)
    • (c) Figure for question 70, option (c)
    • (d) Figure for question 70, option (d)
    Show answer

    Answer: (a)

  62. 74. Figure for question 74

    • (a) Figure for question 74, option (a)
    • (b) Figure for question 74, option (b)
    • (c) Figure for question 74, option (c)
    • (d) Figure for question 74, option (d)
    Show answer

    Answer: (d)

  63. 75. Figure for question 75

    • (a) Figure for question 75, option (a)
    • (b) Figure for question 75, option (b)
    • (c) Figure for question 75, option (c)
    • (d) Figure for question 75, option (d)
    Show answer

    Answer: (d)

  64. 76. Figure for question 76

    • (a) Figure for question 76, option (a)
    • (b) Figure for question 76, option (b)
    • (c) Figure for question 76, option (c)
    • (d) Figure for question 76, option (d)
    Show answer

    Answer: (b)

  65. 77. Figure for question 77

    • (a) Figure for question 77, option (a)
    • (b) Figure for question 77, option (b)
    • (c) Figure for question 77, option (c)
    • (d) Figure for question 77, option (d)
    Show answer

    Answer: (c)

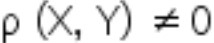
  66. 78. If (X, Y) has a bivariate normal distribution, then X, Y are independent if and only if X, Y are:

    • (a) Figure for question 78, option (a)
    • (b) Figure for question 78, option (b)
    • (c) Figure for question 78, option (c)
    • (d) Figure for question 78, option (d)
    Show answer

    Answer: (b)

  67. 80. Let X1 , X2 , . . . , X10 be 10 independent and identically distributed (i.i.d) random variables taking the values 0, 1 with corresponding probabilities q, p. Then X = X1 + X2+ . . . + X10 is/has:

    • (a) a binomial variate
    • (b) Poisson distribution
    • (c) a normal variate
    • (d) a geometric variate
    Show answer

    Answer: (a)

  68. 82. Figure for question 82

    • (a) Figure for question 82, option (a)
    • (b) Figure for question 82, option (b)
    • (c) Figure for question 82, option (c)
    • (d) Figure for question 82, option (d)
    Show answer

    Answer: (b)

  69. 83. Figure for question 83

    • (a) Figure for question 83, option (a)
    • (b) Figure for question 83, option (b)
    • (c) Figure for question 83, option (c)
    • (d) Figure for question 83, option (d)
    Show answer

    Answer: (d)

  70. 84. Which of the following is NOT true about collecting data through structured interviews?

    • (a) They involve the use of highly standardised techniques of recording.
    • (b) The interviewer follows a rigid laid down procedure.
    • (c) They involve the use of a set of predetermined questions.
    • (d) The sequence of asked questions can be changed.
    Show answer

    Answer: (d)

  71. 85. Figure for question 85

    • (a) Figure for question 85, option (a)
    • (b) Figure for question 85, option (b)
    • (c) Figure for question 85, option (c)
    • (d) Figure for question 85, option (d)
    Show answer

    Answer: (d)

  72. 86. Figure for question 86

    • (a) Figure for question 86, option (a)
    • (b) Figure for question 86, option (b)
    • (c) Figure for question 86, option (c)
    • (d) Figure for question 86, option (d)
    Show answer

    Answer: (c)

  73. 88. In a one-way ANOVA, which of the following would indicate a violation of the normality assumption?

    • (a) Equal variances across groups
    • (b) Residuals showing a skewed distribution
    • (c) Residuals randomly distributed
    • (d) Independent observations
    Show answer

    Answer: (b)

  74. 89. What is the main assumption of the ratio-to-moving-averages method?

    • (a) Seasonal effects are multiplicative.
    • (b) Random components dominate the time series.
    • (c) The trend is constant over time.
    • (d) The seasonal component is additive.
    Show answer

    Answer: (d)

  75. 92. Figure for question 92

    • (a) Figure for question 92, option (a)
    • (b) Figure for question 92, option (b)
    • (c) Figure for question 92, option (c)
    • (d) Figure for question 92, option (d)
    Show answer

    Answer: (d)

  76. 93. From a population of a large number of workers with a standard deviation 5, a sample is drawn and the standard error is found to be 0.5. What is the sample size?

    • (a) 50
    • (b) 1000
    • (c) 10
    • (d) 100
    Show answer

    Answer: (d)

  77. 94. Figure for question 94

    • (a) Figure for question 94, option (a)
    • (b) Figure for question 94, option (b)
    • (c) Figure for question 94, option (c)
    • (d) Figure for question 94, option (d)
    Show answer

    Answer: (b)

  78. 95. Figure for question 95

    • (a) Figure for question 95, option (a)
    • (b) Figure for question 95, option (b)
    • (c) Figure for question 95, option (c)
    • (d) Figure for question 95, option (d)
    Show answer

    Answer: (d)

  79. 97. Figure for question 97

    • (a) Figure for question 97, option (a)
    • (b) Figure for question 97, option (b)
    • (c) Figure for question 97, option (c)
    • (d) Figure for question 97, option (d)
    Show answer

    Answer: (d)

  80. 99. Figure for question 99

    • (a) Figure for question 99, option (a)
    • (b) Figure for question 99, option (b)
    • (c) Figure for question 99, option (c)
    • (d) Figure for question 99, option (d)
    Show answer

    Answer: (a)

  81. 100. Figure for question 100

    • (a) Figure for question 100, option (a)
    • (b) Figure for question 100, option (b)
    • (c) Figure for question 100, option (c)
    • (d) Figure for question 100, option (d)
    Show answer

    Answer: (c)

Show answers

Answer key

Answer key as marked in the Staff Selection Commission’s response sheet. “—” means the sheet did not show it clearly.

Statistics

Q 1
(d)
Q 2
(c)
Q 3
(c)
Q 4
(c)
Q 6
(d)
Q 7
(c)
Q 8
(a)
Q 9
(a)
Q 10
(b)
Q 11
(b)
Q 12
(c)
Q 13
(d)
Q 14
(a)
Q 15
(b)
Q 17
(c)
Q 18
(a)
Q 20
(b)
Q 22
(c)
Q 23
(a)
Q 24
(a)
Q 26
(c)
Q 27
(d)
Q 28
(b)
Q 29
(c)
Q 30
(a)
Q 32
(c)
Q 33
(c)
Q 34
(a)
Q 35
(b)
Q 36
(d)
Q 37
(b)
Q 38
(c)
Q 39
(b)
Q 41
(a)
Q 42
(c)
Q 43
(d)
Q 44
(c)
Q 45
(c)
Q 46
(a)
Q 47
(d)
Q 48
(c)
Q 49
(a)
Q 50
(b)
Q 51
(b)
Q 52
(d)
Q 53
(a)
Q 54
(c)
Q 55
(b)
Q 56
(a)
Q 58
(a)
Q 59
(b)
Q 60
(a)
Q 62
(a)
Q 63
(b)
Q 64
(b)
Q 65
(a)
Q 66
(d)
Q 67
(c)
Q 68
(d)
Q 69
(b)
Q 70
(a)
Q 74
(d)
Q 75
(d)
Q 76
(b)
Q 77
(c)
Q 78
(b)
Q 80
(a)
Q 82
(b)
Q 83
(d)
Q 84
(d)
Q 85
(d)
Q 86
(c)
Q 88
(b)
Q 89
(d)
Q 92
(d)
Q 93
(d)
Q 94
(b)
Q 95
(d)
Q 97
(d)
Q 99
(a)
Q 100
(c)