Verified against official sourcesVerifiedLast updated

ExamBharo

Type to search · Esc to close

ExamBharo · SSC CGL 2024 Tier II — Statistics — 19 January 2025 · exambharo.com/ssc-cgl/previous-year-papers/ssc-cgl-2024-tier-2-statistics-19-jan/

Question paper · SSC CGL

SSC CGL 2024 Tier II — Statistics — 19 January 2025

19 January 2025 · 9:00 AM–11:00 AM81 of the paper’s 100 questions1 per correct answer

Left out of the original paper: 19 (any question that needs a figure, symbol or formatting we cannot show, or whose text or answer did not come through cleanly from the official document).

Questions from the Staff Selection Commission’s paper of 19 January 2025, 9:00 AM–11:00 AM. Each question’s answer is under it, hidden until you open it, and the full answer key is at the end. Take the paper as a timed practice test to be scored.

Statistics

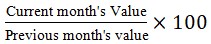
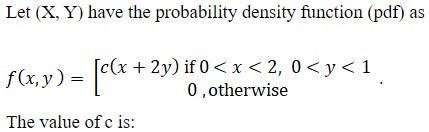
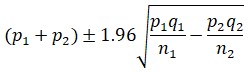
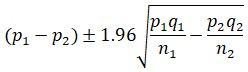
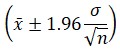
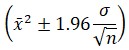
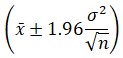
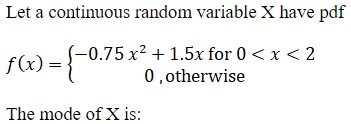
  1. 1. Figure for question 1

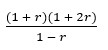
    • (a) Figure for question 1, option (a)
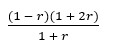
    • (b) Figure for question 1, option (b)
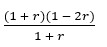
    • (c) Figure for question 1, option (c)
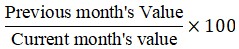
    • (d) Figure for question 1, option (d)
    Show answer

    Answer: (d)

  2. 2. Monthly sales data (in units) shows the following trend-adjusted ratios for three months: January (1.1), February (0.9), and March (1.0). What is the average seasonal index for this quarter?

    • (a) 0.95
    • (b) 0.9
    • (c) 1.0
    • (d) 1.1
    Show answer

    Answer: (c)

  3. 3. Duncan’s Multiple Range Test makes use of which statistical measure?

    • (a) Standard Error of the Means
    • (b) Regression Coefficient
    • (c) Range Statistic (R)
    • (d) F-statistic
    Show answer

    Answer: (c)

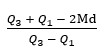
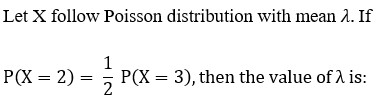
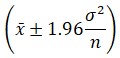
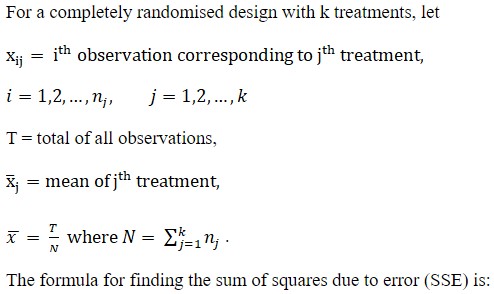
  4. 4. Figure for question 4

    • (a) Figure for question 4, option (a)
    • (b) Figure for question 4, option (b)
    • (c) Figure for question 4, option (c)
    • (d) Figure for question 4, option (d)
    Show answer

    Answer: (c)

  5. 6. If the critical region is evenly distributed, then the test is referred to as:

    • (a) Three tailed
    • (b) Zero tailed
    • (c) One tailed
    • (d) Two tailed
    Show answer

    Answer: (d)

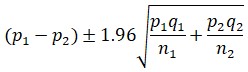
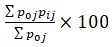
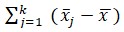
  6. 7. Figure for question 7

    • (a) Figure for question 7, option (a)
    • (b) Figure for question 7, option (b)
    • (c) Figure for question 7, option (c)
    • (d) Figure for question 7, option (d)
    Show answer

    Answer: (c)

  7. 8. In a two-way ANOVA, how many hypotheses are tested?

    • (a) Three
    • (b) One
    • (c) Four
    • (d) Two
    Show answer

    Answer: (a)

  8. 9. In ANCOVA, what happens when the covariate is not linearly related to the dependent variable?

    • (a) The results of ANCOVA may be biased.
    • (b) The covariate becomes irrelevant.
    • (c) All assumptions of ANCOVA are met.
    • (d) The F-statistic becomes insignificant.
    Show answer

    Answer: (a)

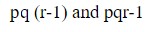
  9. 10. Let X and Y be two independent Poisson variates with rate 5 and 10, respectively, then the E(XY=2) is equal to:

    • (a) Figure for question 10, option (a)
    • (b) Figure for question 10, option (b)
    • (c) Figure for question 10, option (c)
    • (d) Figure for question 10, option (d)
    Show answer

    Answer: (b)

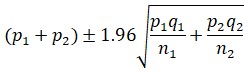
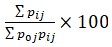
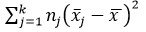
  10. 11. Figure for question 11

    • (a) Figure for question 11, option (a)
    • (b) Figure for question 11, option (b)
    • (c) Figure for question 11, option (c)
    • (d) Figure for question 11, option (d)
    Show answer

    Answer: (b)

  11. 12. Figure for question 12

    • (a) Figure for question 12, option (a)
    • (b) Figure for question 12, option (b)
    • (c) Figure for question 12, option (c)
    • (d) Figure for question 12, option (d)
    Show answer

    Answer: (c)

  12. 13. Figure for question 13

    • (a) Figure for question 13, option (a)
    • (b) Figure for question 13, option (b)
    • (c) Figure for question 13, option (c)
    • (d) Figure for question 13, option (d)
    Show answer

    Answer: (d)

  13. 14. Figure for question 14

    • (a) Figure for question 14, option (a)
    • (b) Figure for question 14, option (b)
    • (c) Figure for question 14, option (c)
    • (d) Figure for question 14, option (d)
    Show answer

    Answer: (a)

  14. 15. Figure for question 15

    • (a) Figure for question 15, option (a)
    • (b) Figure for question 15, option (b)
    • (c) Figure for question 15, option (c)
    • (d) Figure for question 15, option (d)
    Show answer

    Answer: (b)

  15. 17. Figure for question 17

    • (a) Figure for question 17, option (a)
    • (b) Figure for question 17, option (b)
    • (c) Figure for question 17, option (c)
    • (d) Figure for question 17, option (d)
    Show answer

    Answer: (c)

  16. 18. Figure for question 18

    • (a) Figure for question 18, option (a)
    • (b) Figure for question 18, option (b)
    • (c) Figure for question 18, option (c)
    • (d) Figure for question 18, option (d)
    Show answer

    Answer: (a)

  17. 20. Figure for question 20

    • (a) Figure for question 20, option (a)
    • (b) Figure for question 20, option (b)
    • (c) Figure for question 20, option (c)
    • (d) Figure for question 20, option (d)
    Show answer

    Answer: (b)

  18. 22. Figure for question 22

    • (a) Figure for question 22, option (a)
    • (b) Figure for question 22, option (b)
    • (c) Figure for question 22, option (c)
    • (d) Figure for question 22, option (d)
    Show answer

    Answer: (c)

  19. 23. For testing whether two independent Normal populations (with unknown and equal variances) have same mean, one uses:

    • (a) t distribution
    • (b) Standard Normal Distribution
    • (c) Chi Square Distribution
    • (d) F distribution
    Show answer

    Answer: (a)

  20. 24. The following data represents a time series. Period : 1 2 3 4 5 Observed values : 150 140 160 170 180 Compute the first-order and second-order differences for period 3.

    • (a) First-Order: 20, Second-Order: −30
    • (b) First-Order: −10, Second-Order: −10
    • (c) First-Order: −10, Second-Order: 20
    • (d) First-Order: 20, Second-Order: 10
    Show answer

    Answer: (a)

  21. 26. Figure for question 26

    • (a) Figure for question 26, option (a)
    • (b) Figure for question 26, option (b)
    • (c) Figure for question 26, option (c)
    • (d) Figure for question 26, option (d)
    Show answer

    Answer: (c)

  22. 27. A model being fitted is said to be adequate if the residual plot:

    • (a) is quadratic
    • (b) is non-linear
    • (c) is U-shaped
    • (d) displays random pattern
    Show answer

    Answer: (d)

  23. 28. Figure for question 28

    • (a) Figure for question 28, option (a)
    • (b) Figure for question 28, option (b)
    • (c) Figure for question 28, option (c)
    • (d) Figure for question 28, option (d)
    Show answer

    Answer: (b)

  24. 29. Figure for question 29

    • (a) Figure for question 29, option (a)
    • (b) Figure for question 29, option (b)
    • (c) Figure for question 29, option (c)
    • (d) Figure for question 29, option (d)
    Show answer

    Answer: (c)

  25. 30. Figure for question 30

    • (a) Figure for question 30, option (a)
    • (b) Figure for question 30, option (b)
    • (c) Figure for question 30, option (c)
    • (d) Figure for question 30, option (d)
    Show answer

    Answer: (a)

  26. 32. Figure for question 32

    • (a) Figure for question 32, option (a)
    • (b) Figure for question 32, option (b)
    • (c) Figure for question 32, option (c)
    • (d) Figure for question 32, option (d)
    Show answer

    Answer: (c)

  27. 33. Figure for question 33

    • (a) Figure for question 33, option (a)
    • (b) Figure for question 33, option (b)
    • (c) Figure for question 33, option (c)
    • (d) Figure for question 33, option (d)
    Show answer

    Answer: (c)

  28. 34. Level of significance is:

    • (a) Probability of Type I Error
    • (b) 1 − Probability of Type I Error
    • (c) 1 − Probability of Type II Error
    • (d) Probability of Type II Error
    Show answer

    Answer: (a)

  29. 35. Figure for question 35

    • (a) Figure for question 35, option (a)
    • (b) Figure for question 35, option (b)
    • (c) Figure for question 35, option (c)
    • (d) Figure for question 35, option (d)
    Show answer

    Answer: (b)

  30. 36. Figure for question 36

    • (a) Figure for question 36, option (a)
    • (b) Figure for question 36, option (b)
    • (c) Figure for question 36, option (c)
    • (d) Figure for question 36, option (d)
    Show answer

    Answer: (d)

  31. 37. Figure for question 37

    • (a) Figure for question 37, option (a)
    • (b) Figure for question 37, option (b)
    • (c) Figure for question 37, option (c)
    • (d) Figure for question 37, option (d)
    Show answer

    Answer: (b)

  32. 38. Before using secondary data, one need NOT verify:

    • (a) reliability of data
    • (b) suitability of data
    • (c) expenditure involved at time of collection of data
    • (d) adequacy of data
    Show answer

    Answer: (c)

  33. 39. Figure for question 39

    • (a) Figure for question 39, option (a)
    • (b) Figure for question 39, option (b)
    • (c) Figure for question 39, option (c)
    • (d) Figure for question 39, option (d)
    Show answer

    Answer: (b)

  34. 41. Figure for question 41

    • (a) Figure for question 41, option (a)
    • (b) Figure for question 41, option (b)
    • (c) Figure for question 41, option (c)
    • (d) Figure for question 41, option (d)
    Show answer

    Answer: (a)

  35. 42. Figure for question 42

    • (a) Figure for question 42, option (a)
    • (b) Figure for question 42, option (b)
    • (c) Figure for question 42, option (c)
    • (d) Figure for question 42, option (d)
    Show answer

    Answer: (c)

  36. 43. Figure for question 43

    • (a) Figure for question 43, option (a)
    • (b) Figure for question 43, option (b)
    • (c) Figure for question 43, option (c)
    • (d) Figure for question 43, option (d)
    Show answer

    Answer: (d)

  37. 44. Figure for question 44

    • (a) Figure for question 44, option (a)
    • (b) Figure for question 44, option (b)
    • (c) Figure for question 44, option (c)
    • (d) Figure for question 44, option (d)
    Show answer

    Answer: (c)

  38. 45. Figure for question 45

    • (a) Figure for question 45, option (a)
    • (b) Figure for question 45, option (b)
    • (c) Figure for question 45, option (c)
    • (d) Figure for question 45, option (d)
    Show answer

    Answer: (c)

  39. 46. Figure for question 46

    • (a) Figure for question 46, option (a)
    • (b) Figure for question 46, option (b)
    • (c) Figure for question 46, option (c)
    • (d) Figure for question 46, option (d)
    Show answer

    Answer: (a)

  40. 47. O-gives are NOT useful for locating:

    • (a) percentiles
    • (b) median
    • (c) quartiles
    • (d) mean
    Show answer

    Answer: (d)

  41. 48. Figure for question 48

    • (a) Figure for question 48, option (a)
    • (b) Figure for question 48, option (b)
    • (c) Figure for question 48, option (c)
    • (d) Figure for question 48, option (d)
    Show answer

    Answer: (c)

  42. 49. Which component of a time series represents short-term fluctuations due to seasonal factors?

    • (a) Seasonal component
    • (b) Irregular component
    • (c) Cyclical component
    • (d) Trend
    Show answer

    Answer: (a)

  43. 50. Figure for question 50

    • (a) Figure for question 50, option (a)
    • (b) Figure for question 50, option (b)
    • (c) Figure for question 50, option (c)
    • (d) Figure for question 50, option (d)
    Show answer

    Answer: (b)

  44. 51. Which of the following statements is FALSE?

    • (a) An alternative hypothesis is complementary to null hypothesis.
    • (b) The hypothesis for testing mu < mu0 is two sided / two tailed.
    • (c) The null hypothesis H0: mu = mu0 can be tested against the alternative H1: mu not equal to mu0.
    • (d) The hypothesis for testing mu > mu0 is one sided / right tailed.
    Show answer

    Answer: (b)

  45. 52. Figure for question 52

    • (a) Figure for question 52, option (a)
    • (b) Figure for question 52, option (b)
    • (c) Figure for question 52, option (c)
    • (d) Figure for question 52, option (d)
    Show answer

    Answer: (d)

  46. 53. Figure for question 53

    • (a) Figure for question 53, option (a)
    • (b) Figure for question 53, option (b)
    • (c) Figure for question 53, option (c)
    • (d) Figure for question 53, option (d)
    Show answer

    Answer: (a)

  47. 54. Figure for question 54

    • (a) Figure for question 54, option (a)
    • (b) Figure for question 54, option (b)
    • (c) Figure for question 54, option (c)
    • (d) Figure for question 54, option (d)
    Show answer

    Answer: (c)

  48. 55. If S2 is the sample variance of a sample of size n and s2 is an unbiased estimator of population variance, then which of the following is true?

    • (a) Figure for question 55, option (a)
    • (b) Figure for question 55, option (b)
    • (c) Figure for question 55, option (c)
    • (d) Figure for question 55, option (d)
    Show answer

    Answer: (b)

  49. 56. Figure for question 56

    • (a) Figure for question 56, option (a)
    • (b) Figure for question 56, option (b)
    • (c) Figure for question 56, option (c)
    • (d) Figure for question 56, option (d)
    Show answer

    Answer: (a)

  50. 58. Figure for question 58

    • (a) Figure for question 58, option (a)
    • (b) Figure for question 58, option (b)
    • (c) Figure for question 58, option (c)
    • (d) Figure for question 58, option (d)
    Show answer

    Answer: (a)

  51. 59. Figure for question 59

    • (a) Figure for question 59, option (a)
    • (b) Figure for question 59, option (b)
    • (c) Figure for question 59, option (c)
    • (d) Figure for question 59, option (d)
    Show answer

    Answer: (b)

  52. 60. It has been found that 2% of the tools produced by a certain machine are defective. What is the probability that in a shipment of 400 such tools, 3% or more will be defective? (Probability that the normal variate lies between 0 and 1.43 is 0.4236.)

    • (a) 0.0764
    • (b) 0.50
    • (c) 0.4236
    • (d) 1.43
    Show answer

    Answer: (a)

  53. 62. Figure for question 62

    • (a) Figure for question 62, option (a)
    • (b) Figure for question 62, option (b)
    • (c) Figure for question 62, option (c)
    • (d) Figure for question 62, option (d)
    Show answer

    Answer: (a)

  54. 63. Figure for question 63

    • (a) Figure for question 63, option (a)
    • (b) Figure for question 63, option (b)
    • (c) Figure for question 63, option (c)
    • (d) Figure for question 63, option (d)
    Show answer

    Answer: (b)

  55. 64. Figure for question 64

    • (a) Figure for question 64, option (a)
    • (b) Figure for question 64, option (b)
    • (c) Figure for question 64, option (c)
    • (d) Figure for question 64, option (d)
    Show answer

    Answer: (b)

  56. 65. Figure for question 65

    • (a) Figure for question 65, option (a)
    • (b) Figure for question 65, option (b)
    • (c) Figure for question 65, option (c)
    • (d) Figure for question 65, option (d)
    Show answer

    Answer: (a)

  57. 66. Figure for question 66

    • (a) Figure for question 66, option (a)
    • (b) Figure for question 66, option (b)
    • (c) Figure for question 66, option (c)
    • (d) Figure for question 66, option (d)
    Show answer

    Answer: (d)

  58. 67. Figure for question 67

    • (a) Figure for question 67, option (a)
    • (b) Figure for question 67, option (b)
    • (c) Figure for question 67, option (c)
    • (d) Figure for question 67, option (d)
    Show answer

    Answer: (c)

  59. 68. Figure for question 68

    • (a) Figure for question 68, option (a)
    • (b) Figure for question 68, option (b)
    • (c) Figure for question 68, option (c)
    • (d) Figure for question 68, option (d)
    Show answer

    Answer: (d)

  60. 69. Figure for question 69

    • (a) Figure for question 69, option (a)
    • (b) Figure for question 69, option (b)
    • (c) Figure for question 69, option (c)
    • (d) Figure for question 69, option (d)
    Show answer

    Answer: (b)

  61. 70. Figure for question 70

    • (a) Figure for question 70, option (a)
    • (b) Figure for question 70, option (b)
    • (c) Figure for question 70, option (c)
    • (d) Figure for question 70, option (d)
    Show answer

    Answer: (a)

  62. 74. Figure for question 74

    • (a) Figure for question 74, option (a)
    • (b) Figure for question 74, option (b)
    • (c) Figure for question 74, option (c)
    • (d) Figure for question 74, option (d)
    Show answer

    Answer: (d)

  63. 75. Figure for question 75

    • (a) Figure for question 75, option (a)
    • (b) Figure for question 75, option (b)
    • (c) Figure for question 75, option (c)
    • (d) Figure for question 75, option (d)
    Show answer

    Answer: (d)

  64. 76. Figure for question 76

    • (a) Figure for question 76, option (a)
    • (b) Figure for question 76, option (b)
    • (c) Figure for question 76, option (c)
    • (d) Figure for question 76, option (d)
    Show answer

    Answer: (b)

  65. 77. Figure for question 77

    • (a) Figure for question 77, option (a)
    • (b) Figure for question 77, option (b)
    • (c) Figure for question 77, option (c)
    • (d) Figure for question 77, option (d)
    Show answer

    Answer: (c)

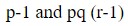
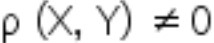
  66. 78. If (X, Y) has a bivariate normal distribution, then X, Y are independent if and only if X, Y are:

    • (a) Figure for question 78, option (a)
    • (b) Figure for question 78, option (b)
    • (c) Figure for question 78, option (c)
    • (d) Figure for question 78, option (d)
    Show answer

    Answer: (b)

  67. 80. Let X1 , X2 , . . . , X10 be 10 independent and identically distributed (i.i.d) random variables taking the values 0, 1 with corresponding probabilities q, p. Then X = X1 + X2+ . . . + X10 is/has:

    • (a) a binomial variate
    • (b) Poisson distribution
    • (c) a normal variate
    • (d) a geometric variate
    Show answer

    Answer: (a)

  68. 82. Figure for question 82

    • (a) Figure for question 82, option (a)
    • (b) Figure for question 82, option (b)
    • (c) Figure for question 82, option (c)
    • (d) Figure for question 82, option (d)
    Show answer

    Answer: (b)

  69. 83. Figure for question 83

    • (a) Figure for question 83, option (a)
    • (b) Figure for question 83, option (b)
    • (c) Figure for question 83, option (c)
    • (d) Figure for question 83, option (d)
    Show answer

    Answer: (d)

  70. 84. Which of the following is NOT true about collecting data through structured interviews?

    • (a) They involve the use of highly standardised techniques of recording.
    • (b) The interviewer follows a rigid laid down procedure.
    • (c) They involve the use of a set of predetermined questions.
    • (d) The sequence of asked questions can be changed.
    Show answer

    Answer: (d)

  71. 85. Figure for question 85

    • (a) Figure for question 85, option (a)
    • (b) Figure for question 85, option (b)
    • (c) Figure for question 85, option (c)
    • (d) Figure for question 85, option (d)
    Show answer

    Answer: (d)

  72. 86. Figure for question 86

    • (a) Figure for question 86, option (a)
    • (b) Figure for question 86, option (b)
    • (c) Figure for question 86, option (c)
    • (d) Figure for question 86, option (d)
    Show answer

    Answer: (c)

  73. 88. In a one-way ANOVA, which of the following would indicate a violation of the normality assumption?

    • (a) Equal variances across groups
    • (b) Residuals showing a skewed distribution
    • (c) Residuals randomly distributed
    • (d) Independent observations
    Show answer

    Answer: (b)

  74. 89. What is the main assumption of the ratio-to-moving-averages method?

    • (a) Seasonal effects are multiplicative.
    • (b) Random components dominate the time series.
    • (c) The trend is constant over time.
    • (d) The seasonal component is additive.
    Show answer

    Answer: (d)

  75. 92. Figure for question 92

    • (a) Figure for question 92, option (a)
    • (b) Figure for question 92, option (b)
    • (c) Figure for question 92, option (c)
    • (d) Figure for question 92, option (d)
    Show answer

    Answer: (d)

  76. 93. From a population of a large number of workers with a standard deviation 5, a sample is drawn and the standard error is found to be 0.5. What is the sample size?

    • (a) 50
    • (b) 1000
    • (c) 10
    • (d) 100
    Show answer

    Answer: (d)

  77. 94. Figure for question 94

    • (a) Figure for question 94, option (a)
    • (b) Figure for question 94, option (b)
    • (c) Figure for question 94, option (c)
    • (d) Figure for question 94, option (d)
    Show answer

    Answer: (b)

  78. 95. Figure for question 95

    • (a) Figure for question 95, option (a)
    • (b) Figure for question 95, option (b)
    • (c) Figure for question 95, option (c)
    • (d) Figure for question 95, option (d)
    Show answer

    Answer: (d)

  79. 97. Figure for question 97

    • (a) Figure for question 97, option (a)
    • (b) Figure for question 97, option (b)
    • (c) Figure for question 97, option (c)
    • (d) Figure for question 97, option (d)
    Show answer

    Answer: (d)

  80. 99. Figure for question 99

    • (a) Figure for question 99, option (a)
    • (b) Figure for question 99, option (b)
    • (c) Figure for question 99, option (c)
    • (d) Figure for question 99, option (d)
    Show answer

    Answer: (a)

  81. 100. Figure for question 100

    • (a) Figure for question 100, option (a)
    • (b) Figure for question 100, option (b)
    • (c) Figure for question 100, option (c)
    • (d) Figure for question 100, option (d)
    Show answer

    Answer: (c)

Show answers

Answer key

Answer key as marked in the Staff Selection Commission’s response sheet. “—” means the sheet did not show it clearly.

Statistics

Q 1
(d)
Q 2
(c)
Q 3
(c)
Q 4
(c)
Q 6
(d)
Q 7
(c)
Q 8
(a)
Q 9
(a)
Q 10
(b)
Q 11
(b)
Q 12
(c)
Q 13
(d)
Q 14
(a)
Q 15
(b)
Q 17
(c)
Q 18
(a)
Q 20
(b)
Q 22
(c)
Q 23
(a)
Q 24
(a)
Q 26
(c)
Q 27
(d)
Q 28
(b)
Q 29
(c)
Q 30
(a)
Q 32
(c)
Q 33
(c)
Q 34
(a)
Q 35
(b)
Q 36
(d)
Q 37
(b)
Q 38
(c)
Q 39
(b)
Q 41
(a)
Q 42
(c)
Q 43
(d)
Q 44
(c)
Q 45
(c)
Q 46
(a)
Q 47
(d)
Q 48
(c)
Q 49
(a)
Q 50
(b)
Q 51
(b)
Q 52
(d)
Q 53
(a)
Q 54
(c)
Q 55
(b)
Q 56
(a)
Q 58
(a)
Q 59
(b)
Q 60
(a)
Q 62
(a)
Q 63
(b)
Q 64
(b)
Q 65
(a)
Q 66
(d)
Q 67
(c)
Q 68
(d)
Q 69
(b)
Q 70
(a)
Q 74
(d)
Q 75
(d)
Q 76
(b)
Q 77
(c)
Q 78
(b)
Q 80
(a)
Q 82
(b)
Q 83
(d)
Q 84
(d)
Q 85
(d)
Q 86
(c)
Q 88
(b)
Q 89
(d)
Q 92
(d)
Q 93
(d)
Q 94
(b)
Q 95
(d)
Q 97
(d)
Q 99
(a)
Q 100
(c)